Tornado charts are commonly used for sensitivity analysis, making it easy to compare the impact that changes in one variable, or source of uncertainty, have on a measured outcome. They are also useful for general comparison scenarios where highlighting differences between two related values is important.
A tornado chart displays data using two opposing bar charts, where each pair of bars represents the same category or independent variable. The bars extend outward from a central value and are sorted so that the widest bars appear at the top and the narrowest at the bottom, creating the characteristic "tornado" shape. This layout makes it easy to identify which variables have the greatest influence on the measured values at a glance.
Building a Bar Chart
Before you begin
Create a new discovery from the User Hub, App Tabs, or on the right-click in the Content Explorer. As part of this process, you will need to open the appropriate Data Model for your analysis. For more information, see Access Discover Pro.
Step 1: Create your Basic Visual
To set up the basic visual:
- Add a hierarchy to the Categories zone.
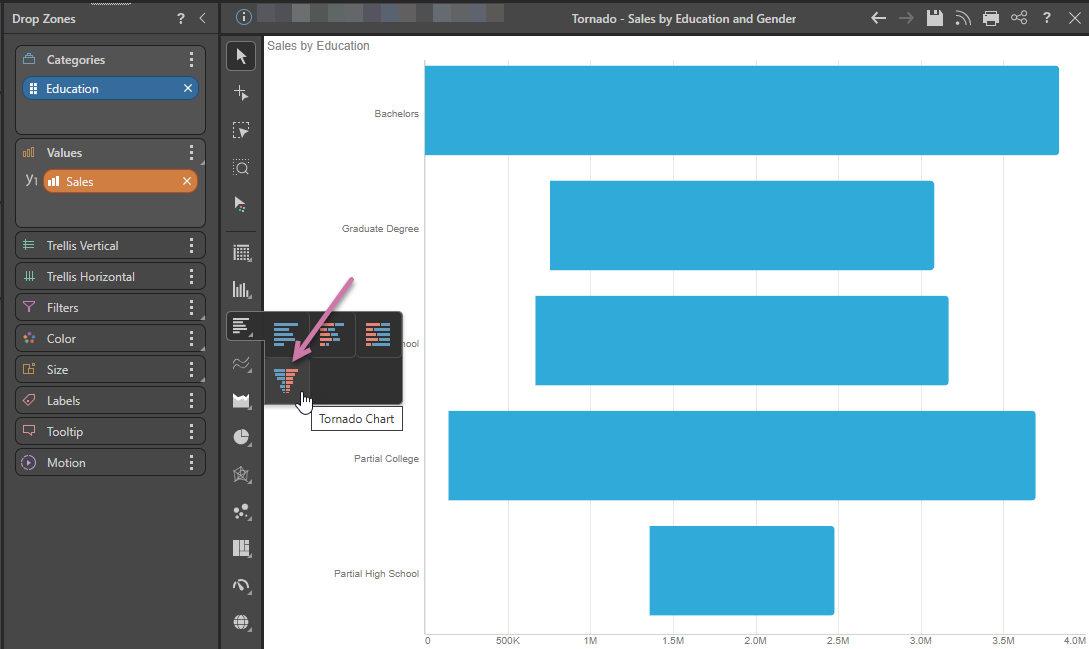
- Right-click Bar Chart > Tornado from the Toolbox (purple arrow below).
- Add the measure to the Values zone.
Double-click the hierarchy in the Dimensions panel. In this example, this is Education.
Tip: The submenu options include Bar Chart, Stacked Bar Chart, and Stacked 100% Bar Chart.
Double-click or select the measure in the Measures panel. In this example, this is Sales.
Tip: If you want to change the visual used for an existing report, you can select a different visual type from the Change Visual dropdown list on Report ribbon.
Step 2: Add Binary Hierarchy
To build a tornado chart, you must place a binary hierarchy; that is, a hierarchy containing exactly two member elements; in the Color drop zone. In this example, the hierarchy is Gender:
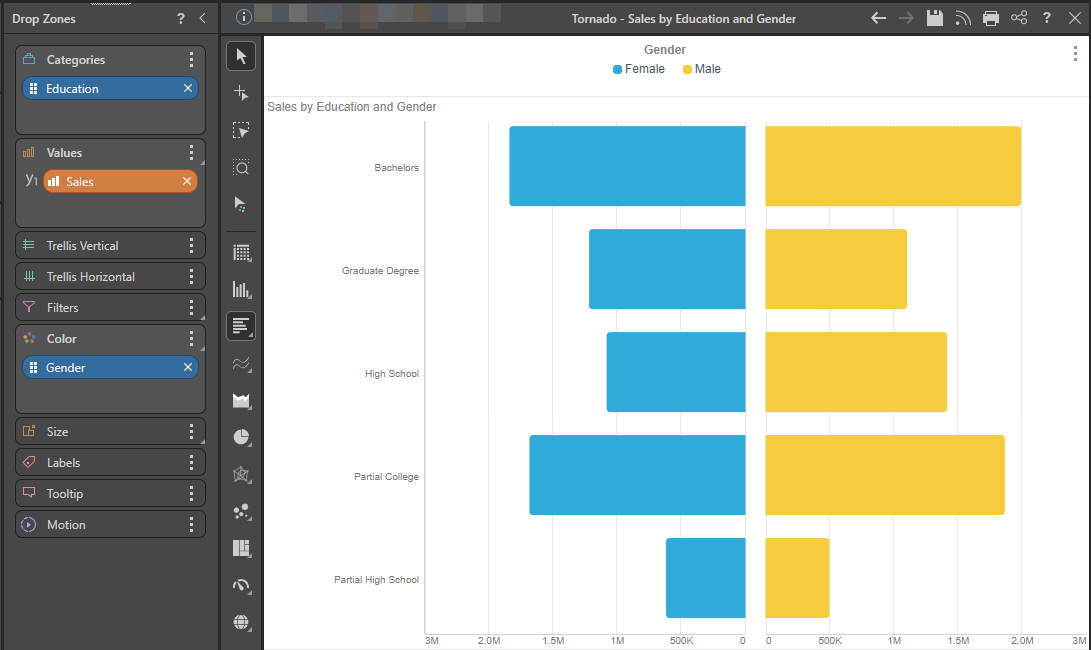
The center value on the x-axis is the smallest value in the data set; depending on the data set, this may be a positive or negative number.
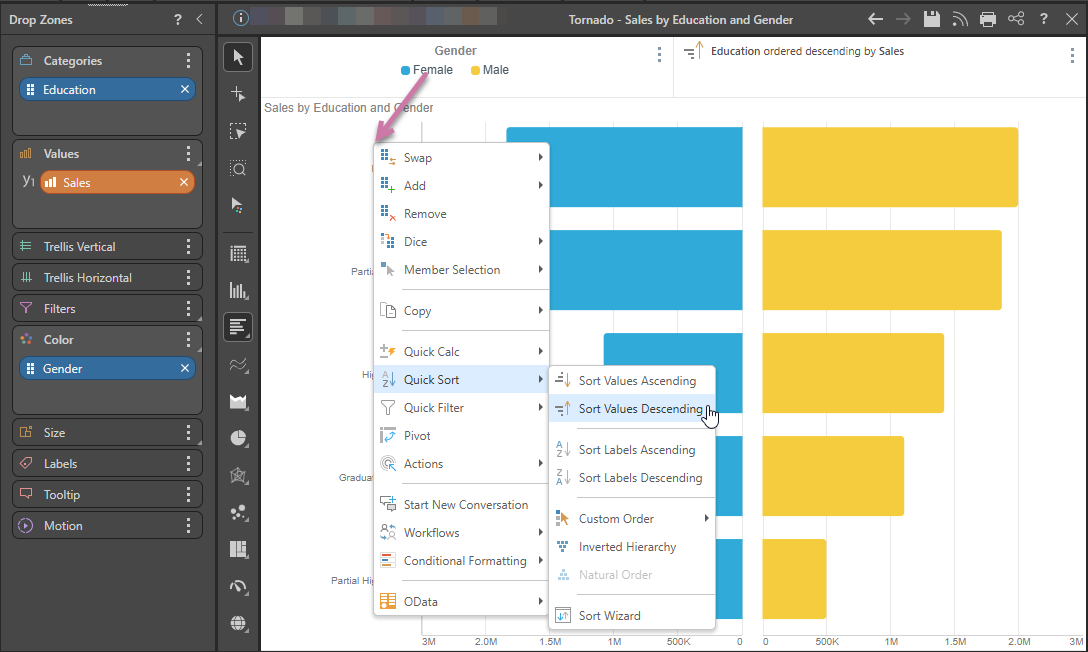
Step 3: Set Descending Order
You can then sort the chart by the hierarchy on the y-axis to display the bars in order of widest to thinnest (creating the Tornado shape). Sort or quick sort the chart by sorting values in descending order from the hierarchy on the y-axis:
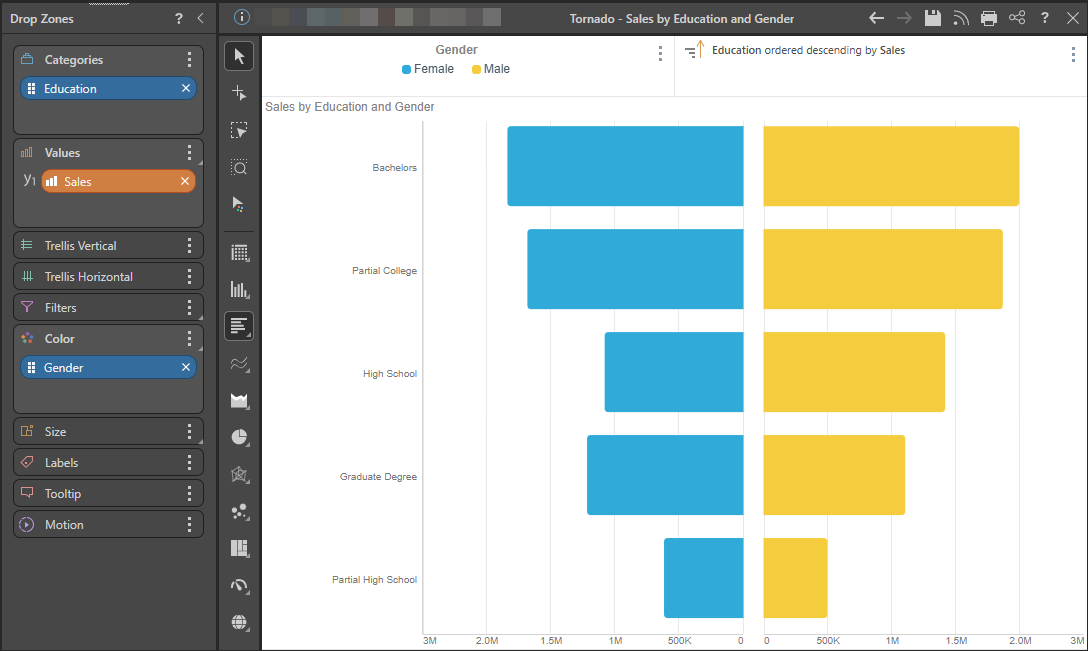
The result will display the widest bars at the top of the chart and the thinnest at the bottom. In the following example, Education and Sales are shown on the axes and Gender drives the color of the columns and legend:
Related information
Quick Styles
Tornado Quick Styles are preset formatting options that let you change the look and feel of a Tornado chart with one click. Applying a Quick Style updates multiple settings at once, including data point transparency, data labels, and legend placement.
- Click here to learn more about Tornado Quick Styles